Wednesday 27 January 2016

Crude Oil Technical Analysis as on 27/01/2016

Crude Oil Inventory Report 

The American Petroleum Institute's weekly crude Oil stockpile report released late Tuesday showed an 11.4 million barrels build, well above the 3.5 million barrels seen. Separately, Wednesday's report from the U.S. Department of Energy could show that domestic crude inventories rose by 3.5 million barrels for the week ending on January 22. 


Technical analysis

The Crude oil market rose during the day on Tuesday. It has been observed that from last several sessions market is not sustaining below the level of $30.00 level, and trying to bounce from lower level. If market is continuing the consolidate above that level, we believe that market can test the level of $32.00 and it will offer a bit of resistance. On its, 4 hourly chart, market is trading between the downward channel. Resistance is seen near down trend resistance trend line at  the level of $34.00 supported by EMA200, while support is seen near the psychological level at $30 supported by EMA50 . On intra day basis we suggest to stay away from the market to monitor the price behavior in the market. We expect crude prices to trade sideways as recent hopes of agreement between OPEC and other producers to curtail output will be supportive. However, investors will be cautious ahead of FOMC statement due tonight.  


Crude Oil Commodity Technical Analysis
Technical Chart
              

Commodity Trading Technical Levels 


R2
R1
S1
S2
GOLD
1138
1126
1109
1098
SILVER
14.82
14.62
14.24
14.08
CRUDE OIL
33.24
32.42
30
29
COPPER
2.0394
2.0150
1.99
1.9438
NATURAL GAS
2.282
2.223
2.051
1.990
PLATINUM
900
888
861
844
PALLADIUM
532
512
478
469

Monday 4 January 2016

EUR/AUD Forex Technical Analysis for 04/01/2016

Technical Analysis 

EUR/AUD is bearish on charts and price is trading below the trend line in its daily chart. In daily chart the price is sustaining below 200 day SMA and cross over of 50 day SMA on the downside indicating downtrend of the pair. It is having an important resistance at the level of 1.5345 and support at the level of 1.4834. If it breaks its support level on the downside and sustains below it then we can expect it to show further bearish movement in the pair.

Euro-AUD-Forex-Technical-analysis

Forex Market Indicators

MACD is sustaining in its negative zone indicating the bearish trend in the pair.
RSI is sustaining in its selling zone indicating the upcoming bearish trend in the pair.

EUR-AUD-Forex-Technical-Chart


Trading Strategy 

EUR/AUD is looking bearish on charts for next few trading session. One can go for sell on higher level strategy for this pair for intra day to mid term positions in it.


Currency Pair Pivot Points

PAIR
S3
S2
S1
PIVOT
R1
R2
R3
EUR/USD
1.0653
1.0748
1.0804
1.0899
1.0955
1.1050
1.1106
GBP/USD
1.4450
1.4586
1.4667
1.4803
1.4884
1.5020
1.5101
USD/JPY
119.30
119.64
119.99
120.33
120.68
121.02
121.37
USD/CHF
0.9713
0.9782
0.9898
0.9967
1.0083
1.0152
1.0268
AUD/USD
0.7161
0.7201
0.7249
0.7289
0.7337
0.7377
0.7425
EUR/GBP
0.7247
0.7290
0.7327
0.7370
0.7407
0.7450
0.7487
USD/CAD
1.3664
1.3738
1.3793
1.3867
1.3922
1.3996
1.4051
NZD/USD
0.6738
0.6776
0.6812
0.6850
0.6886
0.6924
0.6960

Tuesday 29 December 2015

UK Stock Market Analysis/Stock Pick of the Day for 29/12/2015

FTSE Technical Analysis

Stocks and Gilts rose, but prices for industrial metals and the US dollar retreated after the minutes of the US central bank's policy meeting were released overnight.
The initial reaction from many traders and economists to the Federal Reserve's minutes was that a December interest rate hike was now quite possible, but for some - especially the former - apparently not certain.

The FTSE 100 ended the day in green by 50 points at 6329. In the day market, if breach the support level of 6200 on downside after consolidation, then it can test the level of 6140 and the immediate Resistance level is 6260.  

Top Losers

Name
Close Price
Change %
TESCO PLC
150.9
1.31
BT GROUP
467.05
1.24
JOHNSON MATTHEY
2703
1.1
SAGE GRP
596
0.67
WPP
1538
0.65

Top Gainers

Name
Close Price
Change %
BP
365.95
1.54
ANGLO AMERICAN
328.05
1.45
OLD MUTUAL
181.7
1.45
MARKS & SPENCER
453.4
1.43
HAYS
148.3
1.3


Stock of the Day : BARCLAYS PLC


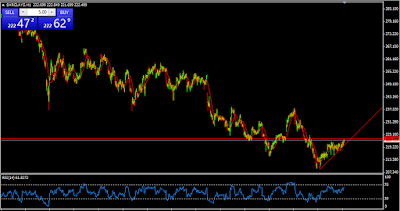
The Major trend of BARCLAYS PLC it is showing strentgh for buying If it crooses the resistance level then one can initiate buying position in the stock. If it crosses the level of 223 then it can test level for the target of 228 with the stop loss of 218

Stock of the day Barclays PLC
Barclays PLC

Technical Chart 

Stock is trading in a range and trading near the trend line. Breaking the resistance line will lead to upside movement. Stock is trading up the 50 DMA with positive bias.

Stock of the Day Barclays PLC Technical Chart
Stock Technical Chart

Stock Technical Analysis/Forecast

RSI is trading near to 60.30 levels with positive bias, in upcoming session upside movement is expected.
MACD and Signal line is sustained above the zero level line.


Tuesday 22 December 2015

Crude Oil Trading Technical Analysis for Today

Crude Oil Technical Analysis

Crude oil prices remained flat on Monday to close at $35.70 per barrel as it remained above its 2009 low and settled up a penny a barrel as trader's squared positions ahead of the January contract's expiration. Record high global oil production, more supplies to be expected from Iran and Libya will further suppress the market sentiments and exert downside pressure on oil supplies. On its 4 hourly chart, market is continue resist by SMA50, which indicate the strong bearish trend ans its RSI is sustaining in its selling zone indicating the upcoming bearish trend. MACD is also printing below its zero level. Crude oil prices is having strong resistance at $38.50 which is supported by EMA50, while support is seen neat the psychological level at $35.00.  On intra day basis Crude oil is looking bearish on charts for. One can go for sell position below the  level of $35.60. Trading volumes are expected to be thin in the coming trading session as many will be away from their desks for the Christmas and New Year holiday season.

Crude Oil Technical Analysis
Crude Oil Technical Chart


  Commodities Support/Resistance for the day 


R2
R1
S1
S2
GOLD
1111
1089
1066
1046
SILVER
14.64
14.42
13.96
13.78
CRUDE OIL
39.05
37.12
35.00
34.00
COPPER
2.1625
2.1444
2.0657
2.0165
NATURAL GAS
2.083
2.025
1.875
1.770
PLATINUM
904
885
856
832
PALLADIUM
603
561
537
523

Tuesday 1 December 2015

EUR/GBP Technical Analysis as on Tuesday, December 01 2015


TECHNICAL ANALYSIS

EUR/GBP is primarily bearish on the charts and the currency pair is sustaining below the trend line in its hourly chart. In hourly chart the price is sustaining below 50 day SMA and taking resistance of 200 day SMA indicating downtrend of the pair. It is having an important resistance at the level of 0.7050 and support at the level of 0.7000. If it breaks its support level on the downside and sustains below it then we can expect it to show further bearish movement in the pair.

EUR-GBP-currency-Technical-Analysis


FOREX INDICATORS

MACD is sustaining in its negative territory indicating the bearish trend in the pair.
RSI is sustaining in its selling zone indicating the upcoming bearish trend in the pair.

EUR-GBP-Currency-Technical-Analysis


TRADING STRATEGY 

EUR/GBP is looking bearish on charts for next few trading session. One can go for sell on higher level strategy for this pair for intra day to mid term positions in it.


                          Currency Pairs Pivot Points

PAIR
S3
S2
S1
PIVOT
R1
R2
R3
EUR/USD
1.0512
1.0534
1.0552
1.0574
1.0592
1.0614
1.0632
GBP/USD
1.4929
1.4960
1.5009
1.5040
1.5089
1.5120
1.5169
USD/JPY
122.10
122.38
122.80
123.08
123.50
123.78
124.20
USD/CHF
1.0189
1.0221
1.0256
1.0288
1.0323
1.0355
1.0390
AUD/USD
0.7100
0.7134
0.7183
0.7217
0.7266
0.7300
0.7349
EUR/GBP
0.6956
0.6983
0.7001
0.7028
0.7046
0.7073
0.7091
USD/CAD
1.3222
1.3265
1.3308
1.3351
1.3394
1.3437
1.3480
NZD/USD
0.6447
0.6480
0.6538
0.6571
0.6629
0.6662
0.6720

Wednesday 4 November 2015

Forex Signal : AUD/USD


Forex Signal : AUD/USD ( 4 HOURLY )

Technical Analysis :

AUD/USD is having bullish secondary trend on the charts. The pair is sustaining below the trend line after breakout and is consolidating at higher levels in its four hourly chart. Price is sustaining above 200 day SMA and 50 day SMA indicating the bullish trend in the pair. It is having an important resistance at the level of 0.7260 and support at the level of 0.7060. If it breaks its resistance level and sustains above it then we can expect it to show further bullish movement in the pair.

AUD/USD Forex Technical Analysis

Forex Indicators:

MACD is supporting the upcoming bullish trend in the pair.
RSI is also sustaining in its buying zone indicating the upcoming bullish trend in the pair.

AUD/USD Forex Technical Chart

Trading Strategy

AUD/USD is looking bearish on charts for next few trading session. One can go for buy on lower level strategy for this pair for intra day to mid term positions.


PAIR
S3
S2
S1
PIVOT
R1
R2
R3
EUR/USD
1.0785
1.0880
1.0915
1.0972
1.1007
1.1065
1.1158
GBP/USD
1.5235
1.5320
1.5370
1.5407
1.5455
1.5493
1.5580
USD/JPY
1.2075
1.2100
1.2110
1.2125
1.2135
1.2150
1.2170
USD/CHF
0.9737
0.9817
0.9869
0.9897
0.9949
0.9977
1.0057
AUD/USD
0.7045
0.7118
0.7160
0.7190
0.7232
0.7262
0.7335
EUR/GBP
0.7093
0.7097
0.7100
0.7101
0.7104
0.7105
0.7109
USD/CAD
1.2835
1.2961
1.3009
1.3087
1.3135
1.3213
1.3339
NZD/USD
0.6443
0.6561
0.6608
0.6679
0.6726
0.6797
0.6915

Wednesday 21 October 2015

UK Stock Market Overview Wednesday, October 21 2015


The UK Stock market declined on Tuesday as investors weighed remarks from the Bank of England's Ian McCafferty and US data.

McCafferty, who was the only member of the Monetary Policy Committed to vote for higher interest rates in the past three meetings, said that the BoE should begin raising rates now to ensure gradual and steady path.
The FTSE 100 ended the day in red by 8 points at 6345. In the day market, if cross the resistance level of 6450 on upside after consolidation, then it can test the level of 6550 and the immediate support level is 6300 .  

Stock to watch : BARCLAYS PLC
RECOMMENDATION SELL
TARGET 249


BARCLAYS PLC  is majorly showing strength for selling. If it breaks the support level then one can initiate selling position in the stock. If it breaks the level of 252 then it can test support level for the target of 249 with the stop loss of 255.

CHART FORMATION:-
Stock is trading in a range and trading near the trend line. Breaking the support line will lead to downside movement. Stock is trading below the 50 DMA with negative bias.


INDICATORS:-
RSI is trading near to 43 levels with negative bias, in upcoming session downside movement is expected.
MACD and Signal line is sustained below the zero level line.