Monday 16 May 2016

Weekly Forex Technical Report for Prominent Currency Pairs

AUD/USD ( 4 HOURLY )
RECOMMENDATION: SELL
The primary trend of AUD/USD is bearish on charts and price is trading below the trend line in its 4 hourly chart. In 4 hourly chart the price is sustaining below 200 day SMA and taking resistance of 50 day SMA on the downside indicating downtrend of the pair. It is having an important resistance at the level of 0.7405 and support at the level of 0.7245. If it breaks its support level on the downside and sustains below it then we can expect it to show further bearish movement in the pair.

INDICATORS:-
MACD is sustaining in its negative territory indicating the bearish trend in the pair.
RSI is sustaining in its selling zone indicating the upcoming bearish trend in the pair.

AUD/USD Forex Technical Analysis

STRATEGY: AUD/USD is looking bearish on charts for next few trading session. One can go for sell on higher level strategy for this pair for intra day to mid term positions in it.


EUR/USD ( DAILY )
RECOMMENDATION: SELL


SUMMARY:
The primary trend of EUR/USD is bearish on charts and price is trading below the trend line in its daily chart. In daily chart the price is sustaining above 200 day SMA and taking resistance of 50 day SMA on the downside indicating downtrend of the pair. It is having an important resistance at the level of 1.1375 and support at the level of 1.1280. If it breaks its support level on the downside and sustains below it then we can expect it to show further bearish movement in the pair.

INDICATORS:-
MACD is sustaining in its negative territory indicating the bearish trend in the pair.
RSI is sustaining in its selling zone indicating the upcoming bearish trend in the pair.

EUD/USD Forex Technical Analysis

STRATEGY: EUR/USD is looking bearish on charts for next few trading session. One can go for sell on higher level strategy for this pair for intra day to mid term positions in it.


GBP/USD ( 4 HOURLY )
RECOMMENDATION: SELL


SUMMARY:
The primary trend of GBP/USD is bearish on charts and price is trading below the trend line in its 4 hourly chart. In 4 hourly chart the price is sustaining below 50 day SMA and taking resistance of 200 day SMA on the downside indicating downtrend of the pair. It is having an important resistance at the level of 1.4425 and support at the level of 1.4340. If it breaks its support level on the downside and sustains below it then we can expect it to show further bearish movement in the pair.

INDICATORS:-
MACD is sustaining in its negative territory indicating the bearish trend in the pair.
RSI is sustaining in its selling zone indicating the upcoming bearish trend in the pair.

GBP/USD Forex Technical Analysis

STRATEGY: GBP/USD is looking bearish on charts for next few trading session. One can go for sell on higher level strategy for this pair for intra day to mid term positions in it.


Wednesday 13 April 2016

GBP/AUD Forex Technical Analysis for 13/4/2016

Technical Analysis

The primary trend of GBP/AUD is bearish on charts and price is trading below the trend line in its hourly chart. In hourly chart the price is sustaining below 200 day SMA and is taking resistance of 50 day SMA indicating downtrend of the pair. It is having an important resistance at the level of 1.9105 and support at the level of 0.8885. If it breaks its support level on the downside and sustains below it then we can expect it to show further bearish movement in the pair.

GBP/AUD

Market Indicators 

MACD is sustaining in its negative territory indicating the bearish trend in the pair.
RSI is sustaining in its selling zone indicating the upcoming bearish trend in the pair.


Trading Strategy 

GBP/AUD is looking bullish on charts for next few trading session. One can go for sell on higher level strategy for this pair for intra day to mid term positions in it.


Friday 8 April 2016

UK Stock Market Analysis and Stock pick of the Day as on 08/04/16

UK Stock Market Overview


London stocks ended lower on Thursday after uninspiring UK fourth quarter economic growth data.
The Office for National Statistics said UK gross domestic product rose 0.5% quarter-on-quarter in the final three months of 2015, up from 0.4% in the third quarter, as expected by analysts.
.
"The preliminary estimate of UK GDP in Q4 confirmed that the recovery ended last year on a slightly lacklustre note, with growth a bit below its trend rate and still driven entirely by the services sector," said Vicky Redwood, chief UK economist at Capital Economics.


The FTSE 100 ended the day in red by 58 points at 5931. In the day market, if it crosses the resistance level of 6000 on upside after consolidation, then it can test the level of 6080 and the immediate Support level is 5920.

UK Stock Market Top Gainers

Name
Close Price
Change %
ANGLO AMERICAN
275.9
8.73
TESCO PLC
166.2
3.23
MORRISON SUPERMKTS
169.5
2.98
ANTOFAGASTA
384
2.29
BP
368.45
1.53

UK Stock Market Top Losers


Name
Close Price
Change %
CARNIVAL
3384
6.42
CENTRICA
200.2
4.71
SHIRE
3879
4.22
VODAFONE GROUP
215.3
3.54
ASTRAZENECA
4347
2.82


Stock Pick of the Day : Standard Chartered PLC


Trend  :  SELL
Target :  435

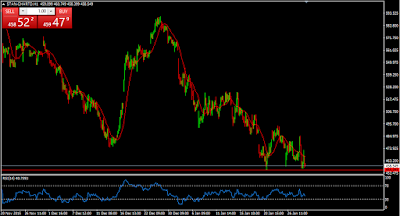
The Major trend of Standard Chartered PLC it is showing strength for selling If it crosses the support level then one can initiate selling position in the stock. If it cross the level of 455 then it can test level for the target of 435 with the stop loss of 475.

Standard Chartered Stock Pick


Technical Chart Formation


Stock is trading in a range and trading near the trend line. Breaking the support line will lead to upside movement. Stock is trading below the 50 DMA with negative bias.

Stock Indicators 


RSI is trading near to 41 levels with negative bias, in upcoming session downside movement is expected.

MACD and Signal line is sustained below the zero level line.

Monday 4 April 2016

Commodities Technical Analysis and Strategies for Wednesday, April 15 2015


Gold

Gold markets fell during the bulk of the session on Tuesday, but found good support above the 1180 level to turn things back around and formed a hammer. With this, we believe that the market should continue to go between the 1180 level on the bottom, and the 1220 level on the top. It seems as if we are ready to rally at this point and head back towards the 1220 level given enough time. Considering both ways, this is a short term traders market and so, we will have to be very nimble.

Gold Technical Analysis
Gold Technical Chart


SILVER

Silver markets fell during the session on Tuesday, but found enough support at the $16 level to turn things back around and formed a hammer. With this, we believe that the market is going to continue to consolidate and it’s only a matter of time before we break out to the upside. That breakout is expected below the 17.50 level in our opinion, and as a result we believe that this is a short-term buying opportunity.

Silver Technical Analysis
Silver Technical Chart


CRUDE OIL

Light sweet crude oil markets rose during the course of the session on Tuesday, but failed to break above the $54 level. We believe that there is a significant amount of resistance at the $55 level as well, where there is no potential for buying opportunity. We are looking for some type of resistive candle in order to start selling. In order to start buying, we believe that a break above $56 is needed , so at this point of time we are still very bearish in this market. Our approach towards the top of the resistance barrier and more importantly the consolidation area, we believe that the sellers will step back in. So, we do not see any buying opportunity yet.
Crude Oil Technical Analysis
Silver Technical Chart


Wednesday 30 March 2016

EUR/AUD Technical Analysis for the day

Technical Analysis

EUR/AUD is having bearish secondary trend  on the charts and the pair is trading below the trend line in its hourly chart. In hourly chart the price is sustaining below 200 day SMA and taking resistance of 50 day SMA indicating downtrend of the pair. It is having an important resistance at the level of 1.5590 and support at the level of 1.5345. If it breaks its support level on the downside and sustains below it then we can expect it to show further bearish movement in the pair.

EUR/AUD Technical Analysis for the Day
EUR/AUD

Forex Indicators

MACD is sustaining in its negative territory indicating the bearish trend in the pair.
RSI is sustaining in its selling zone indicating the upcoming bearish trend in the pair.

Technical Chart


Trading Strategy 

EUR/AUD is looking bearish on charts for next few trading session. One can go for sell on higher level strategy for this pair for intra day to mid term positions in it.


Thursday 17 March 2016

Crude Oil Technical analysis for 17/03/2016

U.S. crude oil stocks rose last week rose to record highs for a fifth straight week while gasoline inventories fell amid strong demand for the motor fuel, data from the Energy Information Administration showed on Wednesday. Crude inventories increased 1.3 million barrels in the week to March 11 to 523.2 million, a much smaller build than the 3.4 million-barrel increase expected by analysts. By 10:55 a.m. EDT, U.S. futures were up 3.7 percent at $37.71 per barrel. 


Crude Oil


On technical chart, Very short term trend of crude oil is bullish on chart. On its, 4 hourly chart, market has been making higher lows and higher highs from past few trading session. Crude oil also took support of 50 DMA and bounce back from the same on 4 hourly chart. It has been trading with support of SMA50 and SMA200 with appearance golden cross. Now it can test the next resistance of   41.90. On lower side it is having support of previous significant low of 35.90. On daily charts it has strong bullish candle. RSI is sustaining in its positive territory indicating the bearish trend on intra day basis.


Crude Oil technical Chart

Technical Pivot Levels

Commodity
R2
R1
S1
S2
GOLD
1284
1264
1224
1190
SILVER
16.35
15.82
15.11
14.6
CRUDE OIL
41.90
39.80
38.30
36.60
COPPER
2.2800
2.2570
2.2100
2.1890
NATURAL GAS
1.980
1.916
1.755
1.600
PLATINUM
1008
990
947
925
PALLADIUM
610
584
555
528


Friday 4 March 2016

UK Stock Market Technical Analysis and Stock Picks


UK stocks advanced on Thursday, although the FTSE 100 was marginally lower as China's central bank devalued its currency for a third day and as Greece's economy expanded in the second quarter.
The People's Bank of China devalued the yuan for the third consecutive day on Thursday. The Bank set the parity rate at 6.4010 yuan for $1, down 1.11% from the previous day's 6.3306, in an effort to boost exports to feed the slowing economy.

The FTSE 100 ended the day in red by 2.86 points at 6568.33. If during the day market cross the resistance level of 6630 on upside after consolidation, then it can test the level of 6700 and the immediate support level is 6500.


Stock Pick of the Day

JOHNSON MATTHEY PLC GROUP

RECOMMENDATION SELL

TARGET 2840
The Major trend of JOHNSON MATTHEY PLC it is showing strength for selling .If it breaks the support level then one can initiate the selling position in the stock. If it breaks the level of 2840 then it can test support level for the target of 2805 with the stop loss of 2875.

CHART FORMATION:-
Stock is trading in a range and trading near the trendline. Breaking the support line will lead to downside movement. Stock is trading below the 50 DMA with negative bias.

INDICATORS:-
RSI is trading near to 44.82 level with negative bias, in upcoming session downside movement is expected.
MACD and Signal line is sustaining below the zero level line.

Thursday 4 February 2016

Gold Trading Signals Technical Analysis for 4/2/2016

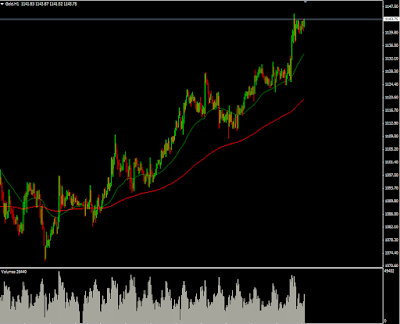
Gold prices ended the U.S. day session solidly higher and scored another three-month high Wednesday. Gold bulls also have building technical momentum on their side and pushed prices to a fresh three-month high. Comex gold was last up $16.20 at $1,143.50 ounce. 

Gold trading Technical Analysis
Gold Trading
Gold market look like is ready to go to the next significant level at $1155.00. With that, we believe that the buyers are going to get very aggressive. Resistance is seen near the level of $1160.00, while support is seen near the level at $1127.00. On intraday basis Gold price trade higher today. On intraday charts it is trading with support of 50 DMA and 200 DMA with appearance of golden cross.

Gold technical Analysis
Technical Chart

Wednesday 27 January 2016

Crude Oil Technical Analysis as on 27/01/2016

Crude Oil Inventory Report 

The American Petroleum Institute's weekly crude Oil stockpile report released late Tuesday showed an 11.4 million barrels build, well above the 3.5 million barrels seen. Separately, Wednesday's report from the U.S. Department of Energy could show that domestic crude inventories rose by 3.5 million barrels for the week ending on January 22. 


Technical analysis

The Crude oil market rose during the day on Tuesday. It has been observed that from last several sessions market is not sustaining below the level of $30.00 level, and trying to bounce from lower level. If market is continuing the consolidate above that level, we believe that market can test the level of $32.00 and it will offer a bit of resistance. On its, 4 hourly chart, market is trading between the downward channel. Resistance is seen near down trend resistance trend line at  the level of $34.00 supported by EMA200, while support is seen near the psychological level at $30 supported by EMA50 . On intra day basis we suggest to stay away from the market to monitor the price behavior in the market. We expect crude prices to trade sideways as recent hopes of agreement between OPEC and other producers to curtail output will be supportive. However, investors will be cautious ahead of FOMC statement due tonight.  


Crude Oil Commodity Technical Analysis
Technical Chart
              

Commodity Trading Technical Levels 


R2
R1
S1
S2
GOLD
1138
1126
1109
1098
SILVER
14.82
14.62
14.24
14.08
CRUDE OIL
33.24
32.42
30
29
COPPER
2.0394
2.0150
1.99
1.9438
NATURAL GAS
2.282
2.223
2.051
1.990
PLATINUM
900
888
861
844
PALLADIUM
532
512
478
469

Monday 4 January 2016

EUR/AUD Forex Technical Analysis for 04/01/2016

Technical Analysis 

EUR/AUD is bearish on charts and price is trading below the trend line in its daily chart. In daily chart the price is sustaining below 200 day SMA and cross over of 50 day SMA on the downside indicating downtrend of the pair. It is having an important resistance at the level of 1.5345 and support at the level of 1.4834. If it breaks its support level on the downside and sustains below it then we can expect it to show further bearish movement in the pair.

Euro-AUD-Forex-Technical-analysis

Forex Market Indicators

MACD is sustaining in its negative zone indicating the bearish trend in the pair.
RSI is sustaining in its selling zone indicating the upcoming bearish trend in the pair.

EUR-AUD-Forex-Technical-Chart


Trading Strategy 

EUR/AUD is looking bearish on charts for next few trading session. One can go for sell on higher level strategy for this pair for intra day to mid term positions in it.

Currency Pair Pivot Points

PAIR
S3
S2
S1
PIVOT
R1
R2
R3
EUR/USD
1.0653
1.0748
1.0804
1.0899
1.0955
1.1050
1.1106
GBP/USD
1.4450
1.4586
1.4667
1.4803
1.4884
1.5020
1.5101
USD/JPY
119.30
119.64
119.99
120.33
120.68
121.02
121.37
USD/CHF
0.9713
0.9782
0.9898
0.9967
1.0083
1.0152
1.0268
AUD/USD
0.7161
0.7201
0.7249
0.7289
0.7337
0.7377
0.7425
EUR/GBP
0.7247
0.7290
0.7327
0.7370
0.7407
0.7450
0.7487
USD/CAD
1.3664
1.3738
1.3793
1.3867
1.3922
1.3996
1.4051
NZD/USD
0.6738
0.6776
0.6812
0.6850
0.6886
0.6924
0.6960