Showing posts with label UK stock of the day. Show all posts

Friday 8 April 2016

UK Stock Market Analysis and Stock pick of the Day as on 08/04/16

UK Stock Market Overview


London stocks ended lower on Thursday after uninspiring UK fourth quarter economic growth data.
The Office for National Statistics said UK gross domestic product rose 0.5% quarter-on-quarter in the final three months of 2015, up from 0.4% in the third quarter, as expected by analysts.
.
"The preliminary estimate of UK GDP in Q4 confirmed that the recovery ended last year on a slightly lacklustre note, with growth a bit below its trend rate and still driven entirely by the services sector," said Vicky Redwood, chief UK economist at Capital Economics.


The FTSE 100 ended the day in red by 58 points at 5931. In the day market, if it crosses the resistance level of 6000 on upside after consolidation, then it can test the level of 6080 and the immediate Support level is 5920.

UK Stock Market Top Gainers

Name
Close Price
Change %
ANGLO AMERICAN
275.9
8.73
TESCO PLC
166.2
3.23
MORRISON SUPERMKTS
169.5
2.98
ANTOFAGASTA
384
2.29
BP
368.45
1.53

UK Stock Market Top Losers


Name
Close Price
Change %
CARNIVAL
3384
6.42
CENTRICA
200.2
4.71
SHIRE
3879
4.22
VODAFONE GROUP
215.3
3.54
ASTRAZENECA
4347
2.82


Stock Pick of the Day : Standard Chartered PLC


Trend  :  SELL
Target :  435

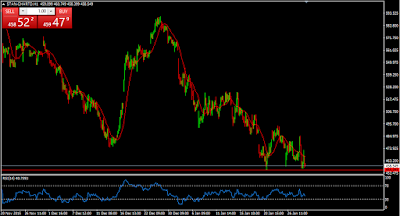
The Major trend of Standard Chartered PLC it is showing strength for selling If it crosses the support level then one can initiate selling position in the stock. If it cross the level of 455 then it can test level for the target of 435 with the stop loss of 475.

Standard Chartered Stock Pick


Technical Chart Formation


Stock is trading in a range and trading near the trend line. Breaking the support line will lead to upside movement. Stock is trading below the 50 DMA with negative bias.

Stock Indicators 


RSI is trading near to 41 levels with negative bias, in upcoming session downside movement is expected.

MACD and Signal line is sustained below the zero level line.
Tuesday 29 December 2015

UK Stock Market Analysis/Stock Pick of the Day for 29/12/2015

FTSE Technical Analysis

Stocks and Gilts rose, but prices for industrial metals and the US dollar retreated after the minutes of the US central bank's policy meeting were released overnight.
The initial reaction from many traders and economists to the Federal Reserve's minutes was that a December interest rate hike was now quite possible, but for some - especially the former - apparently not certain.

The FTSE 100 ended the day in green by 50 points at 6329. In the day market, if breach the support level of 6200 on downside after consolidation, then it can test the level of 6140 and the immediate Resistance level is 6260.  

Top Losers

Name
Close Price
Change %
TESCO PLC
150.9
1.31
BT GROUP
467.05
1.24
JOHNSON MATTHEY
2703
1.1
SAGE GRP
596
0.67
WPP
1538
0.65

Top Gainers

Name
Close Price
Change %
BP
365.95
1.54
ANGLO AMERICAN
328.05
1.45
OLD MUTUAL
181.7
1.45
MARKS & SPENCER
453.4
1.43
HAYS
148.3
1.3


Stock of the Day : BARCLAYS PLC


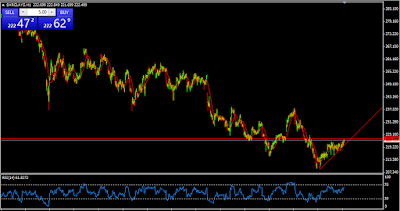
The Major trend of BARCLAYS PLC it is showing strentgh for buying If it crooses the resistance level then one can initiate buying position in the stock. If it crosses the level of 223 then it can test level for the target of 228 with the stop loss of 218

Stock of the day Barclays PLC
Barclays PLC

Technical Chart 

Stock is trading in a range and trading near the trend line. Breaking the resistance line will lead to upside movement. Stock is trading up the 50 DMA with positive bias.

Stock of the Day Barclays PLC Technical Chart
Stock Technical Chart

Stock Technical Analysis/Forecast

RSI is trading near to 60.30 levels with positive bias, in upcoming session upside movement is expected.
MACD and Signal line is sustained above the zero level line.


Wednesday 21 October 2015

UK Stock Market Overview Wednesday, October 21 2015


The UK Stock market declined on Tuesday as investors weighed remarks from the Bank of England's Ian McCafferty and US data.

McCafferty, who was the only member of the Monetary Policy Committed to vote for higher interest rates in the past three meetings, said that the BoE should begin raising rates now to ensure gradual and steady path.
The FTSE 100 ended the day in red by 8 points at 6345. In the day market, if cross the resistance level of 6450 on upside after consolidation, then it can test the level of 6550 and the immediate support level is 6300 .  

Stock to watch : BARCLAYS PLC
RECOMMENDATION SELL
TARGET 249


BARCLAYS PLC  is majorly showing strength for selling. If it breaks the support level then one can initiate selling position in the stock. If it breaks the level of 252 then it can test support level for the target of 249 with the stop loss of 255.

CHART FORMATION:-
Stock is trading in a range and trading near the trend line. Breaking the support line will lead to downside movement. Stock is trading below the 50 DMA with negative bias.


INDICATORS:-
RSI is trading near to 43 levels with negative bias, in upcoming session downside movement is expected.
MACD and Signal line is sustained below the zero level line.

Thursday 13 November 2014

UK Stock Pick of the Day and its Technical Analysis


Technical Report of UK stock pick of the day Unilever PLC
Stock of the Day

RECOMMENDATION BUY
TARGET 2675
The primary trend of Unilever Plc is side ways and it's consolidating near to resistance level crossing of the resistance can show northward journey .Stock has shown recovery from the bottom and manages show positive bias from last few trading sessions.One can initiates the long position in the stock above the level of 2575 with the stop loss of 2525 for the target of 2675.

CHART FORMATION:-
Stock is showing consolidation and sustain at higher level with positive bias.
It's trading above 50 DMA and facing resistance from 200 DMA crossing above it can show upside movement

Detailed technical analysis of the UK stock pick of the day unilever plc
Technical chart

INDICATORS:-
RSI is trading near to level of 70and showing consolidation , Breaching of the resistance level can manage to test further high.
In ADX , Positive DI is placed above negative which is indicating strength for buying.
Macd & Signal line is about to give break out above Zero level line which is indicating strength in the stock.

Friday 31 October 2014

U.K. Stock of the day : Close Brother Group Plc


Technical amnalysis of the stock of the day
click to enlarge
RECOMMENDATION BUY
TARGET 1475
The primary trend of Close Brother Group Plc is sideways , From last week it is consolidating near to resistance level with positive bias. Stock is looking strong for upcoming session as it has given the break out of 1410 and sustains above that after crossing of the strong resistance i.e. 1430 it can test the level of 1475 with the stop loss if 1404.
 
CHART FORMATION:-
Stock is trading with near to resistance level and consolidating with positive bias crossing of resistance can show northward journey.
Stock is sustaining above 50 DMA and 200 DMA with positive bias.
 
INDICATORS:-
RSI is trading near to the level of 50 and showing consolidation , Breaching of the resistance level can manage to test the level of 70.
In ADX is trading above 25 level , Positive DI is placed above negative which is indicating strength for buying.
Macd & Signal line is trading above Zero level line which is indicating strength in the stock.

Wednesday 29 October 2014

FTSE stock pick of the day : Cobham Plc


Stock pick of the day for Londaon stock exchange
FTSE stock pick of the day
RECOMMENDATION BUY
TARGET 286
The primary trend of the stock is Bearish and from last few trading session stock is showing strength for buying and looking strong on charts. Stock is trading with support from the falling tren d line and manages to sustain above the trendline with positive bias.Stock is facing immediate resistance from the level of 279 crossing of it can show fresh buying and it can test the level of 286 after crossing it's 200 DMA at 283 with the stop loss of 274.

CHART FORMATION:-

Stock is trading with support of falling trend line and forming ascending triangle crossing of the level line can show upside movement.
Stock is sustaining above 50 DMA and facing support from 200 DMA crossing of it can show upside movement.

Technical analysis chart for Cobham Plc
Click to enlarge


INDICATORS:-

RSI is trading near to the level of 50 and showing consolidation , Breaching of the resistance level can manage to test the level of 70.
In ADX , Positive DI is placed above negative with positive bias.
Macd & Signal line is trading above Zero level line which is indicating strength in the stock.

Wednesday 8 October 2014

FTSE stock pick of the day


Coca Cola Hbc Ord


RECOMMENDATION BUY
TARGET 1399
The primary trend of Coca Cola Hbc Plc is side ways and from last few trading session stock is showing strength for buying and looking strong on charts.Sto ck is showing buying from dips and facing resistance from the falling trend line breaching of it can show upside movement .One can make a long position in the stock above the level of 1345 with sl of 1315 for the target of 1399.

CHART FORMATION:-
Stock has managing to trade with positive bias and consolidating near to resistance level crossing of it can show northward journey.
It's facing resistance from 200 DMA breaching of the 200 DMA can test the level of 1399.

U.K. Stock pick of the day

INDICATORS:-
RSI is trading near to the level of 50 and showing consolidation , Breaching of the resistance level can manage to test the level of 70.
In ADX , Positive DI has given the break out above negative DI which is confirm strength in the buying side.