UK Stock Market Overview
London
stocks ended lower on Thursday after uninspiring UK fourth quarter
economic growth data.
The
Office for National Statistics said UK gross domestic product rose
0.5%
quarter-on-quarter in the final three months of 2015, up from 0.4%
in the third quarter, as expected by analysts.
.
"The
preliminary estimate of UK GDP in Q4 confirmed that the recovery
ended last year on a slightly lacklustre note, with growth a bit
below its trend rate and still driven entirely by the services
sector," said Vicky Redwood, chief UK economist at Capital
Economics.
The
FTSE 100 ended the day in red by 58 points at 5931. In the day
market, if it crosses the resistance level of 6000 on upside after
consolidation, then it can test the level of 6080 and the immediate
Support level
is 5920.
UK Stock Market Top Gainers
Name
|
Close
Price
|
Change
%
|
ANGLO AMERICAN
|
275.9
|
8.73
|
TESCO PLC
|
166.2
|
3.23
|
MORRISON SUPERMKTS
|
169.5
|
2.98
|
ANTOFAGASTA
|
384
|
2.29
|
BP
|
368.45
|
1.53
|
UK Stock Market Top Losers
Name
|
Close
Price
|
Change
%
|
CARNIVAL
|
3384
|
6.42
|
CENTRICA
|
200.2
|
4.71
|
SHIRE
|
3879
|
4.22
|
VODAFONE
GROUP
|
215.3
|
3.54
|
ASTRAZENECA
|
4347
|
2.82
|
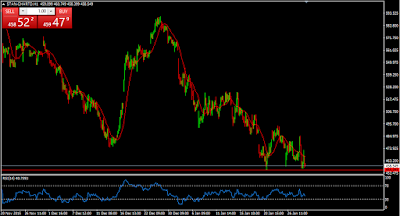
Stock Pick of the Day : Standard Chartered PLC
Trend : SELL
Target : 435
The
Major trend of Standard Chartered PLC it is showing strength for selling If it crosses the support level
then one can initiate selling position in the stock. If it cross the
level of 455 then it can test level for the target of 435 with the
stop loss of 475.
Technical Chart Formation
Stock is trading in a range and trading near the trend line. Breaking
the support line will lead to upside movement. Stock is trading below
the 50 DMA with negative bias.
Stock Indicators
RSI is trading near to 41 levels
with negative bias, in upcoming session downside movement is
expected.
MACD and Signal line is
sustained below the zero level line.


