Showing posts with label uk stock market. Show all posts

Friday, 8 April 2016

UK Stock Market Analysis and Stock pick of the Day as on 08/04/16

UK Stock Market Overview


London stocks ended lower on Thursday after uninspiring UK fourth quarter economic growth data.
The Office for National Statistics said UK gross domestic product rose 0.5% quarter-on-quarter in the final three months of 2015, up from 0.4% in the third quarter, as expected by analysts.
.
"The preliminary estimate of UK GDP in Q4 confirmed that the recovery ended last year on a slightly lacklustre note, with growth a bit below its trend rate and still driven entirely by the services sector," said Vicky Redwood, chief UK economist at Capital Economics.


The FTSE 100 ended the day in red by 58 points at 5931. In the day market, if it crosses the resistance level of 6000 on upside after consolidation, then it can test the level of 6080 and the immediate Support level is 5920.

UK Stock Market Top Gainers

Name
Close Price
Change %
ANGLO AMERICAN
275.9
8.73
TESCO PLC
166.2
3.23
MORRISON SUPERMKTS
169.5
2.98
ANTOFAGASTA
384
2.29
BP
368.45
1.53

UK Stock Market Top Losers


Name
Close Price
Change %
CARNIVAL
3384
6.42
CENTRICA
200.2
4.71
SHIRE
3879
4.22
VODAFONE GROUP
215.3
3.54
ASTRAZENECA
4347
2.82


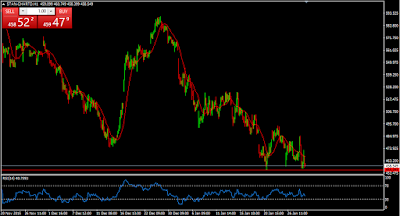
Stock Pick of the Day : Standard Chartered PLC


Trend  :  SELL
Target :  435

The Major trend of Standard Chartered PLC it is showing strength for selling If it crosses the support level then one can initiate selling position in the stock. If it cross the level of 455 then it can test level for the target of 435 with the stop loss of 475.

Standard Chartered Stock Pick


Technical Chart Formation


Stock is trading in a range and trading near the trend line. Breaking the support line will lead to upside movement. Stock is trading below the 50 DMA with negative bias.

Stock Indicators 


RSI is trading near to 41 levels with negative bias, in upcoming session downside movement is expected.

MACD and Signal line is sustained below the zero level line.
Monday, 27 July 2015

UK Stock Market Technical Analysis Monday, July 27 2015

MARKET OVERVIEW

Far weaker than expected data on the US housing markets proved to be the proverbial straw that broke the camel's back on Friday, setting off another round of selling in stocks and commodities ahead of next week's US Federal Reserve policy meeting
The FTSE 100 ended the day in red by 75.20 points at 6579.81 But if during the day market breaches the support level of 6550 on the downside after consolidation, then it can test the level of 6500 and the immediate resistance level is 6600


RELX PLC GROUP 
 

RECOMMENDATION SELL
TARGET 1085
The Major trend of RELX PLC it is showing strength for selling .If it breaks the support level then one can initiate the selling position in the stock. If it breaks the level of 1096 then it can test support level for the target of 1085 with the stop loss of 1106

CHART FORMATION:-
Stock is trading in a range and trading near the trendline. Breaking the support line will lead to downside movement. Stock is trading below the 50 DMA with negetive bias.

INDICATORS:-
RSI is trading near to 38.22 level with negetive bias, in upcoming session downside movement is expected.
MACD and Signal line is sustaining below the zero level line.

Thursday, 19 February 2015

UK Stock Market last Session's Updates


London Stock Exchange
 
London stocks close flat after investors book profit with Index eases from all time high as markets reviewed positive flow regarding Greece. Greece confirmed on Wednesday that it will request a six-month extension "loan agreement" with its European creditors, but is not willing to continue on the same terms as its existing bailout agreement.
The FTSE 100 hit 15- year high on Wednesday and ended the session down just 0.05 points at 6898.08, retreating after hitting an intra-day high of 6,921.32. If during the day market is breaching the resistance level of 6930 on upside after consolidation, then it can test the level of 7010 with the support of 6880.


TOP GAINER
Name
Close Price
Change %
Royal BK Scotl GR
396.5
2.59
Enterprise Inns
112.3
2.18
WPP
1482
2.14
Standard Chartered
966
2.10
Anglo American
1259
1.94

TOP LOSER

Name
Close Price
Change %
Vodafone Group
225.45
2.51
Brit Land Co Reit
811.5
2.23
Rexam
537
2.01
Land Sec Reit
1223
1.85
Shire
5100
1.64

Friday, 6 February 2015

London Stock Exchange Overview as on Friday, February 06 2015


London stock Exchange overview
London Stock Exchange Overview
UK stocks ended with minor gains after mixed Eurozone news. On Thursday session data from UK showed a better-than-expected jump in German factory orders, a contraction in Eurozone like-for-like retail sales, an easing in the growth rate of UK new car registrations. The FTSE 100 finished the day up with minor gains up 0.1% at 6866, earlier in the day prices has bounced strongly after hitting an intraday low of 6808.19.
If during the day market is breaching the resistance level of 6890 on upside after consolidation, then it can test the level of 6960 with the support of 6840.

TOP GAINER
Name
Close Price
Change %
Rexam
538
20.2
BT Group
442
4.49
Smith & Nephew
1198
2.57
BG Group
954.8
2.45
Rolls- Royce Hldgs
918
2.06

TOP LOSER

Name
Close Price
Change %
Astrazeneca
4529
3.39
Vodafone Group
230.9
2.37
Man Group
175.5
2.34
BAE Systems
516.5
2.09
ITV
226
1.99

Tuesday, 3 February 2015

FTSE Overview as on Tuesday, February 03 2015


UK stocks recover from lower levels and closed higher after a choppy session as oil stocks gain. Manufacturing purchasing managers' indices (PMIs) from across the globe came in mixed, with growth picking up in the UK.
The FTSE 100 close at 6782.55, up 0.5% on the day after swinging between gains and losses.
The Index has recovered from lower level of the day and ended in positive note. If during the day market is breaching the resistance level of 6850 on upside after consolidation, then it can test the level of 6940 with the support of 6780.

TOP GAINER
Name
Close Price
Change %
BG Group
934.2
5.33
Sainsbury
267.3
4.66
Antofagasta
672
3.38
BP
437.7
3.12
BHP Billiton
1484
2.84

TOP LOSER

Name
Close Price
Change %
Carnival
2921
2.54
United Utilities GR
1001
2.53
Wolseley
3770
2.38
Kingfisher
335.1
2.25
Severn Trent
2106
2.14


Stock Pick of the day : BG GroupPlc


RECOMMENDATION BUY
TARGET 965
The Major trend of BG Group Plc is Consolidating in higher levels and it is showing strength and reversal from lower levels on charts and we can see upside movement in it. Stock is trading near its resistance of 935. One can initiate the long position in the stock if it breaks the level of 940 it can show upside movement for the target of 965 with the stop loss of 920.

CHART FORMATION:-
Stock is consolidating on higher level and showing sign for reversal movement in it. Crossing the resistance will lead to upside movement. Stock is trading above the 50 DMA with positive bias.

INDICATORS:-
RSI is trading near to 60 level with positive bias, in upcoming session upside movement is expected.
MACD and Signal line is sustaining above the zero level line.

Monday, 2 February 2015

UK Stock Market Overview as on Monday, February 02 2015


UK Stock Market Overview
London Stock Exchange
UK stocks falls on Friday after Eurozone consumer prices fell more than forecasts and the rate of US economic growth slowed sharply. The Eurozone fell further into deflation in January with consumer prices falling at an annual rate of 0.6% after a 0.2% fall the month before, worse than the 0.5% drop expected. The FTSE 100 close at 6749, down 0.9% on the day and close lowest since 21st January.
The Index has shown weakness and close near two week low and during the day if market is breaching the support level of 6720 on downside after consolidation, then it can test the level of 6640 with the resistance of 6800.

TOP GAINER
Name
Close Price
Change %
BHP Billiton
1443
2.09
Smiths Group
1127
1.53
Anglo American
1113
1.41
Rio Tinto
2925
1.35
DLY Mail& Gen TST A
860.47
1.23

TOP LOSER

Name
Close Price
Change %
Sainsbury
255.40
3.18
Rexam
425
3.03
Morrison Supermkts
179.90
2.70
BT Group
417.90
2.61
Diageo
1970
2.60


Investec Plc

Technical Report of the Investec Plc Stock
Technical Chart


RECOMMENDATION SELL
TARGET 544
The Major trend of Investec Plc is Consolidating in higher levels and it is showing weakness on charts and we can see downside movement in it. Stock is trading near its support of 556. One can initiate the short position in the stock if it breaks the level of 556 it can show downside movement for the target of 544 with the stop loss of 566.

CHART FORMATION:-
Stock is consolidating on higher level and showing weakness for downside movement in it for correction. Crossing the support will lead to downside movement. Stock is trading below the 50 DMA with negative bias.

INDICATORS:-
RSI is trading near to 43 level with negative bias , in upcoming session downside movement is expected.
MACD and Signal line is sustaining below the zero level line.

Wednesday, 28 January 2015

UK Stocks Overview as on Wednesday, January 28 2015


UK stocks falls after figure shown that economic growth slowed to just 0.5% in fourth quarter of 2014 due to contractions in construction and production. The FTSE 100 fell 0.6% to 6811.61. Market falls from its highest level in four and a half months. There is strong resistance at 6920 level and during the day if market is breaching the level of 6835 then it can test the level of 6920 with the support of 6720.

TOP GAINER
Name
Close Price
Change %
Centrica
282.70
4.16
SSE
1545
1.91
United Utilities GR
1015
1.70
BP
445.68
1.52
Sage Grp
484
0.83

TOP LOSER

Name
Close Price
Change %
Rolls-Royse Hldgs
879
2.66
ITV
225.90
2.5
Anglo American
1090
2.46
Johnson Matthey Plc
3497
2.02
Pearson
1321
1.86

Monday, 8 December 2014

UK Stock Market Technical Analysis


British banks were in the money on Friday as positive job news across the Pond revived the prospect of a US rate hike in 2015. The FTSE fell initially during the course of the week, but found enough support near the 6650 level to turn things back and closed on positive note at 6742 .The market is facing resistance from the level of 6780 and any pull back is a buying opportunity.As index is forming strong pattern for further buying, crossing of resistance level can test the level of 6900 with the support of 6600.

TOP GAINER
Name
Close Price
Change %
Kingfisher
328.2
3.21
Vodafone Group
230.6
3.11
Schroders Nvtg
2171
3.04
Barclays
249.45
2.8
Carnival
2805
2.75

TOP LOSER

Name
Close Price
Change %
Bhp Bhilliton
1474
-1.73
Bg Group
907.5
-1.7
Next
6655
-1.48
Rio Tinto
2898
-1.21
Anglo American
1268
-1.21


Fidelity European Value Plc


Detailed technical chart of Fidelity European stock pick of the day
Technical Chart

RECOMMENDATION BUY
TARGET 170
The major trend of Fidelity European Value Plc is bullish and it is showing strenght for upside and manages to sustain above the trend line.For upcoming session stock is looking strong on charts and facing resistance from l65 level crossing of it can show upside movement and can test the level of 170 with stop loss of 160.


CHART FORMATION:-
Stock has looking strong on charts and Flag pattern crossing of neck line can show upside movement.
It's trading above the 50 DMA and200 DMA crossing with positive bias.

INDICATORS:-
RSI is trading above the 50 level and showing consolidation , crossing of 60 level it can test the level of 70.
Macd & Signal line is trading above Zero level line with positive bias.

Monday, 17 November 2014

UK Stock Market Technical Analysis and Stock Pick


UK stock market ended the final session of the week with modest gains, but struggled against weakness among the mining and energy sectors. The FTSE has broke higher during the course of the week, clearing the 6600 level with ease and manage to end the week at 6,648.13, a gain of 12.68 points on the day and 80.89 on the week. Index is looking further strong for upcommings session and sustaining above 6600 level it can test 6900 level continues to be one of the better performing ones in the European region with support of 6400 level.

TOP GAINER
Name
Close Price
Change %
Hays
127.3
2.17
Tesco Plc
195.1
2.07
Sainsbury
268.1
1.13
Kingfisher
296
1.75
Bg Group
1046
1.7

TOP LOSER

Name
Close Price
Change %
Sabmiller
3495
-1.69
Astrazeneca
4651
-1.71
Rexam Imperial Tobacco
442.5
-1.91
Rio Tinto
2848
-0.97
Smith & Nephew
3017
-0.9


UK Stock Pick of the Day : Severn Trent Plc 


RECOMMENDATION BUY
TARGET 2095
The primary trend of Severn trent Plc is bullish and it's consolidating near to resistance level crossing of the resistance can show northward journey .Stock is sustaining above the trend line with positive bias, crossing of the psychological level of 2000 it can show fresh buying .One can initiate long position in the stock above the level of 2000 with the stop loss of 1949 for the target of 2095.

CHART FORMATION:-
Stock has given the break out of falling trend line and forming bullish pattern breaching of the level 2000 it can show upside movement.
It's trading above the 50 DMA & 200 DMA with the positive bias.


INDICATORS:-
RSI is trading above the 50 level and showing consolidation, crossing of 60 level it can test the level of 70.
Macd & Signal line is about to give break out above Zero level line which is indicating strength in the stock.